
References
Home
Toolbar
Expressions
Time Format
Preferences
Import
Perl Import Filter
Perl Data Filter
Command Line
Inspectors
Attribute Inspector
Data Buffer
Data
MySQL
Curve Fit
Macro
Macro
Miscellaneous
Search
Plot2 Documentation
Introduction
Plot is a scientific 2D plotting program.
This project started in 1993 with SciPlot on NeXTStep and continues with "Plot" for OS X till 2007.
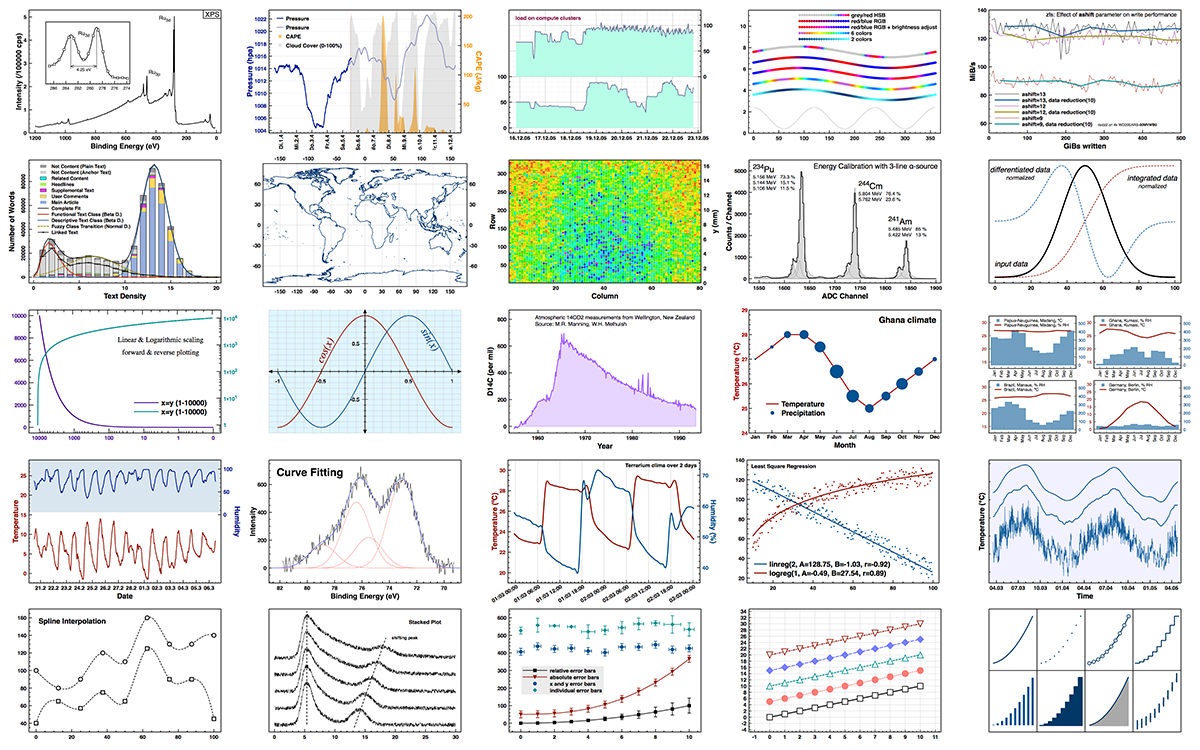
Plot is designed for everyday plotting, it is easy to use, it creates high quality plots, and it allows easy and powerful manipulations and calculations of data.
Basically Plot allows to work with multiple documents where every document consists of one or more XY data sets (called buffer in Plot).
There is also the possibility to add subviews (plots inside plots) to your document. A subview is completely independent with its own data buffers, graphic attributes etc.
Data can be imported from text or binary files, directly from a MySQL database or with a Perl based import filter. It is also possible to import data by using copy&paste or drag&drop from other programs.
Plot supports many plotting styles like lines, symbols, grids, bars, filled areas, sticks, dots, histograms, error bars, automatic legend, text and graphic objects, etc.
Plot can import images from other programs with copy&paste or drag&drop.
Plot has many data manipulation methods integrated: smooth, spline interpolation, differentiation, integration, normalizing, moving, data calculations, function generator, curve fitting, etc.
Plot has also a built in macro language for automating complex tasks with with ~300 commands, ~80 functions and ~200 variables.
This documentation is valid for Plot2 version 2.6.11
Links